Source Data Review
Reviewed financial transaction exports, budget files, and account structures across multiple operating entities.
Power BI · DAX · Financial Reporting · Data Modeling
A business intelligence case study focused on consolidating financial reporting across multiple campground and RV resort entities. The project transforms separate QuickBooks-style financial exports, account mappings, and budget files into a centralized Power BI reporting model for executive review.
The campground group operated multiple locations, each with its own financial export structure and account-level reporting differences. Accounting staff had to export reports, copy data into Excel, manually map accounts, reconcile totals, and prepare executive summaries.
Because each entity used a similar but not identical chart of accounts, the monthly consolidation process was time-consuming, inconsistent, and vulnerable to manual error. Leadership needed a repeatable reporting framework that could consolidate actuals, budget data, prior-year results, and entity-level performance into one executive dashboard suite.
Reviewed financial transaction exports, budget files, and account structures across multiple operating entities.
Mapped local entity accounts into standardized corporate reporting categories so financial results could be consolidated consistently.
Built repeatable transformation logic to clean transactions, standardize financial fields, integrate budget data, and prepare reporting tables.
Designed a centralized financial star schema with transaction facts and supporting dimensions for date, entity, account, financial category, and budget analysis.
Created reusable measures for revenue, expenses, net profit, profit margin, budget achievement, variance, YoY comparison, and YTD analysis.
Built executive-facing Power BI pages to support financial review, budget monitoring, location comparison, and management attention areas.
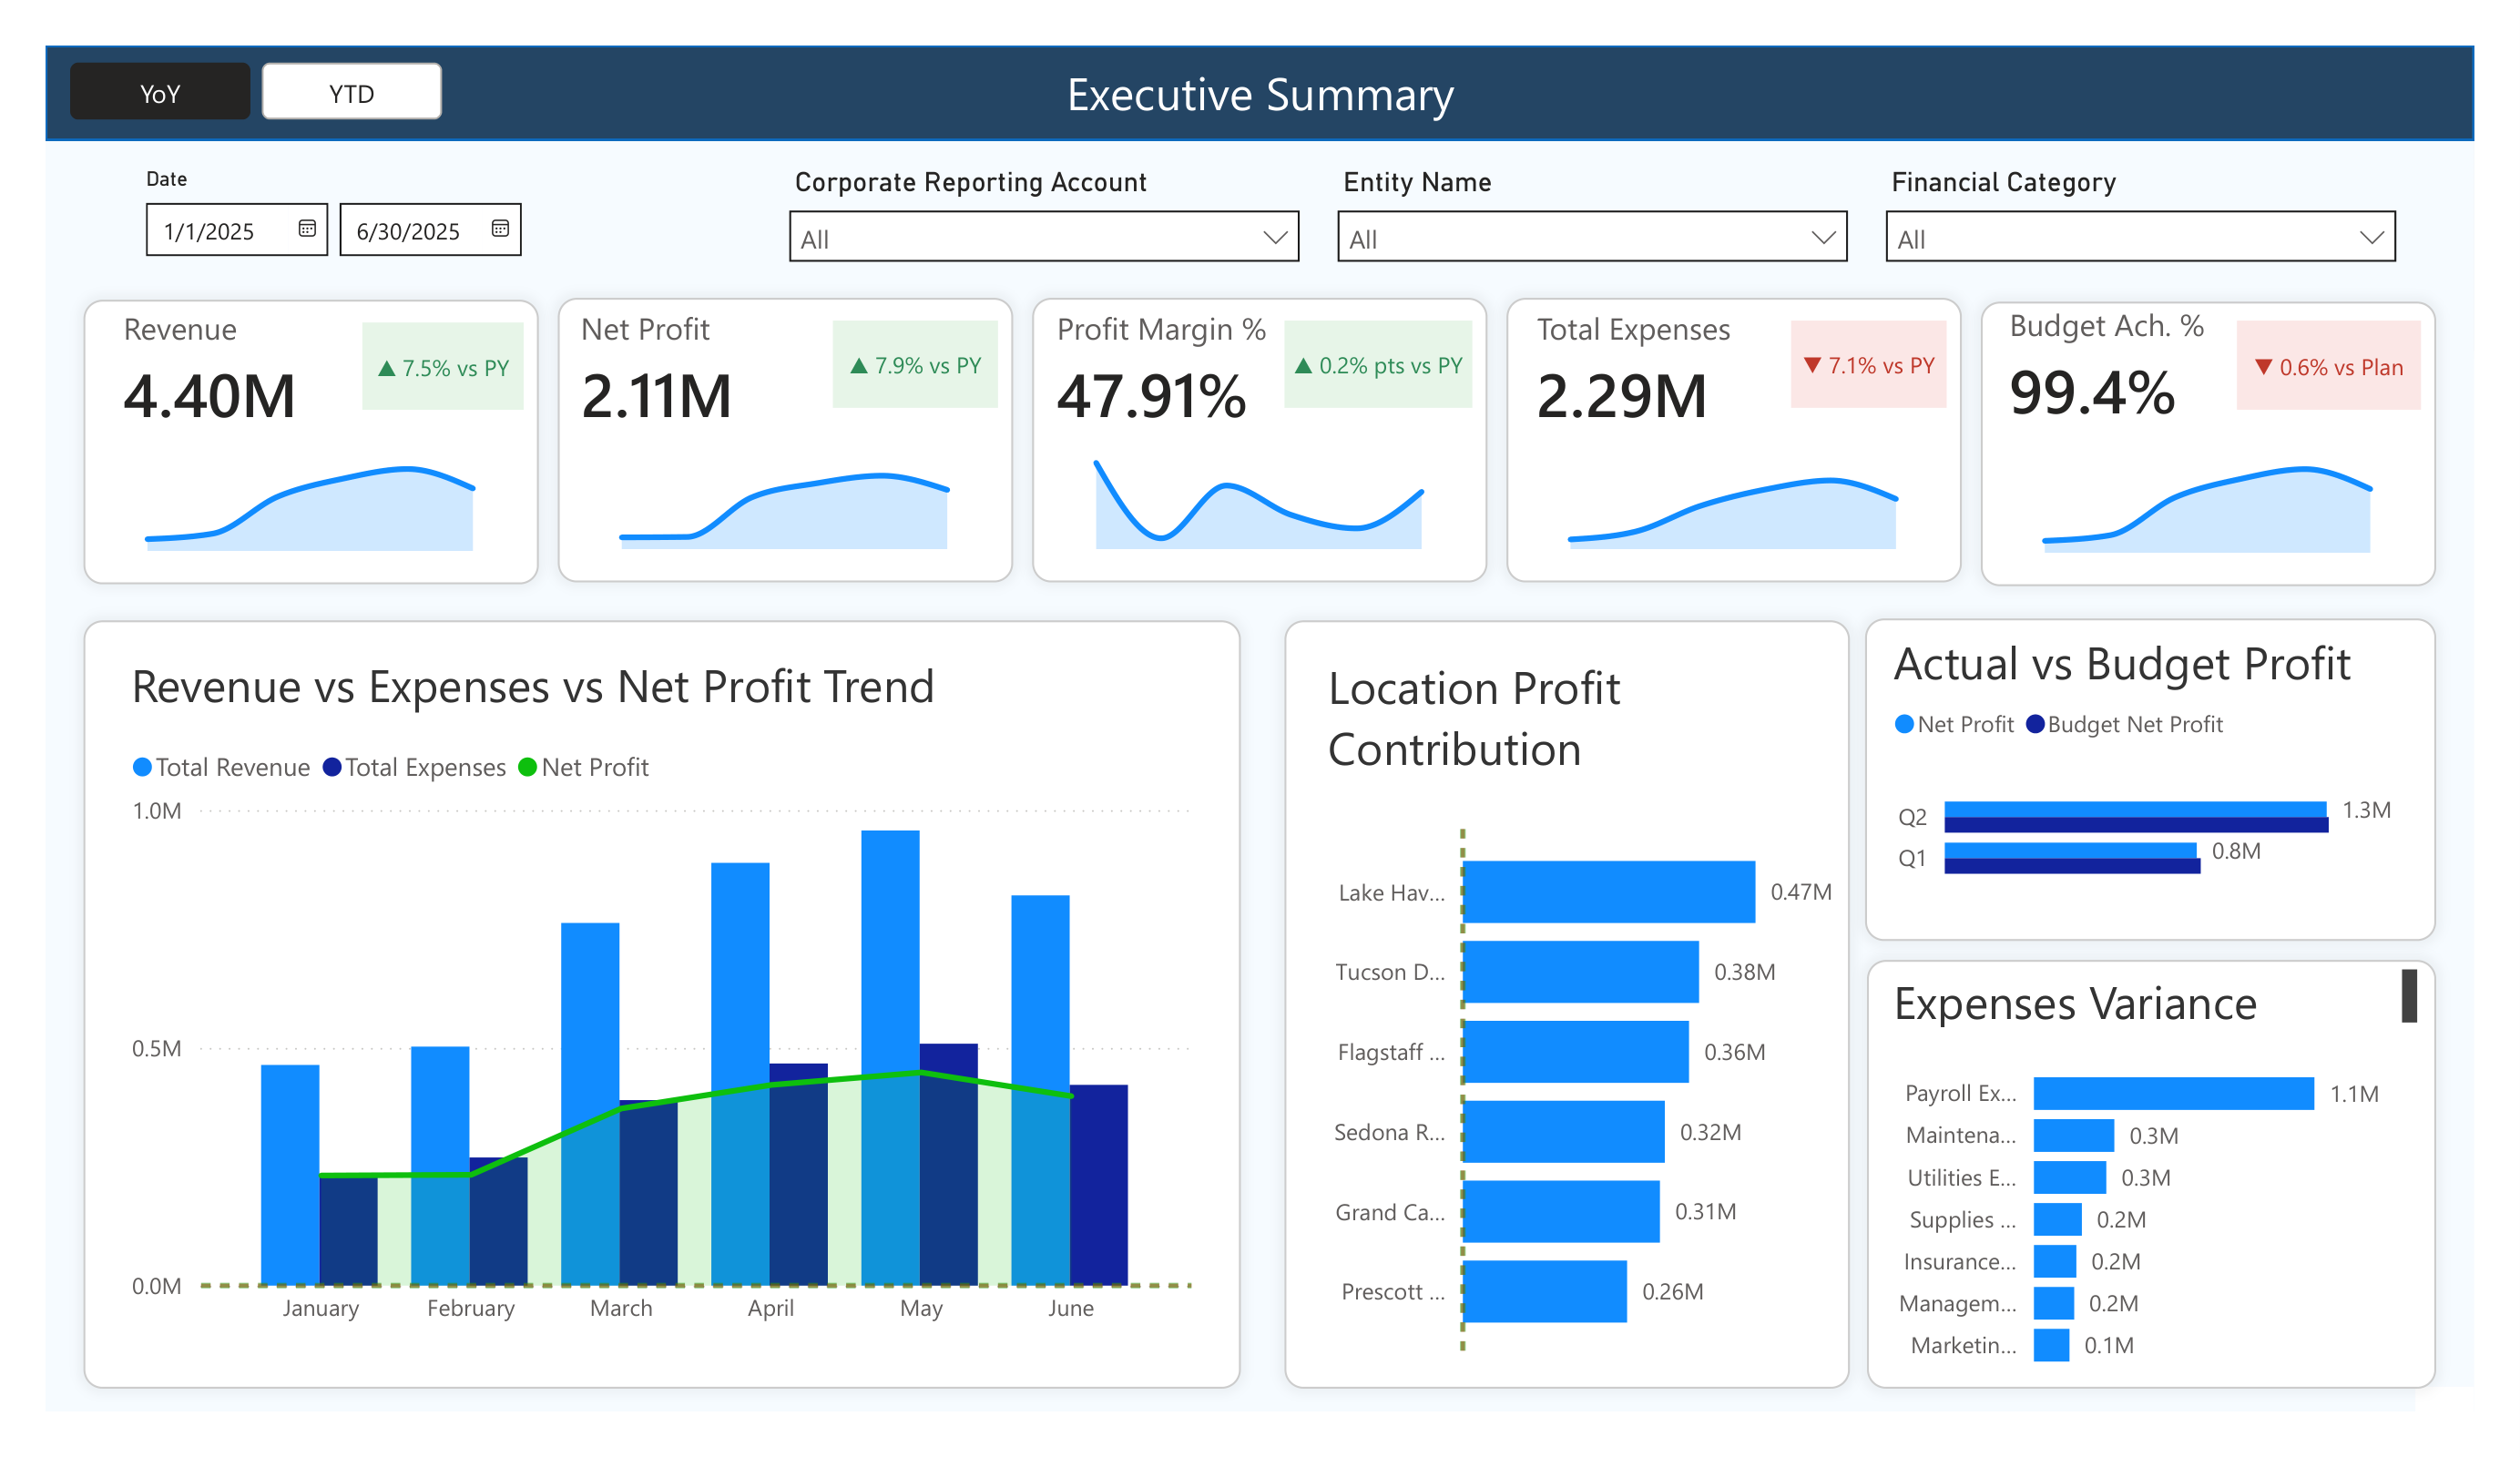
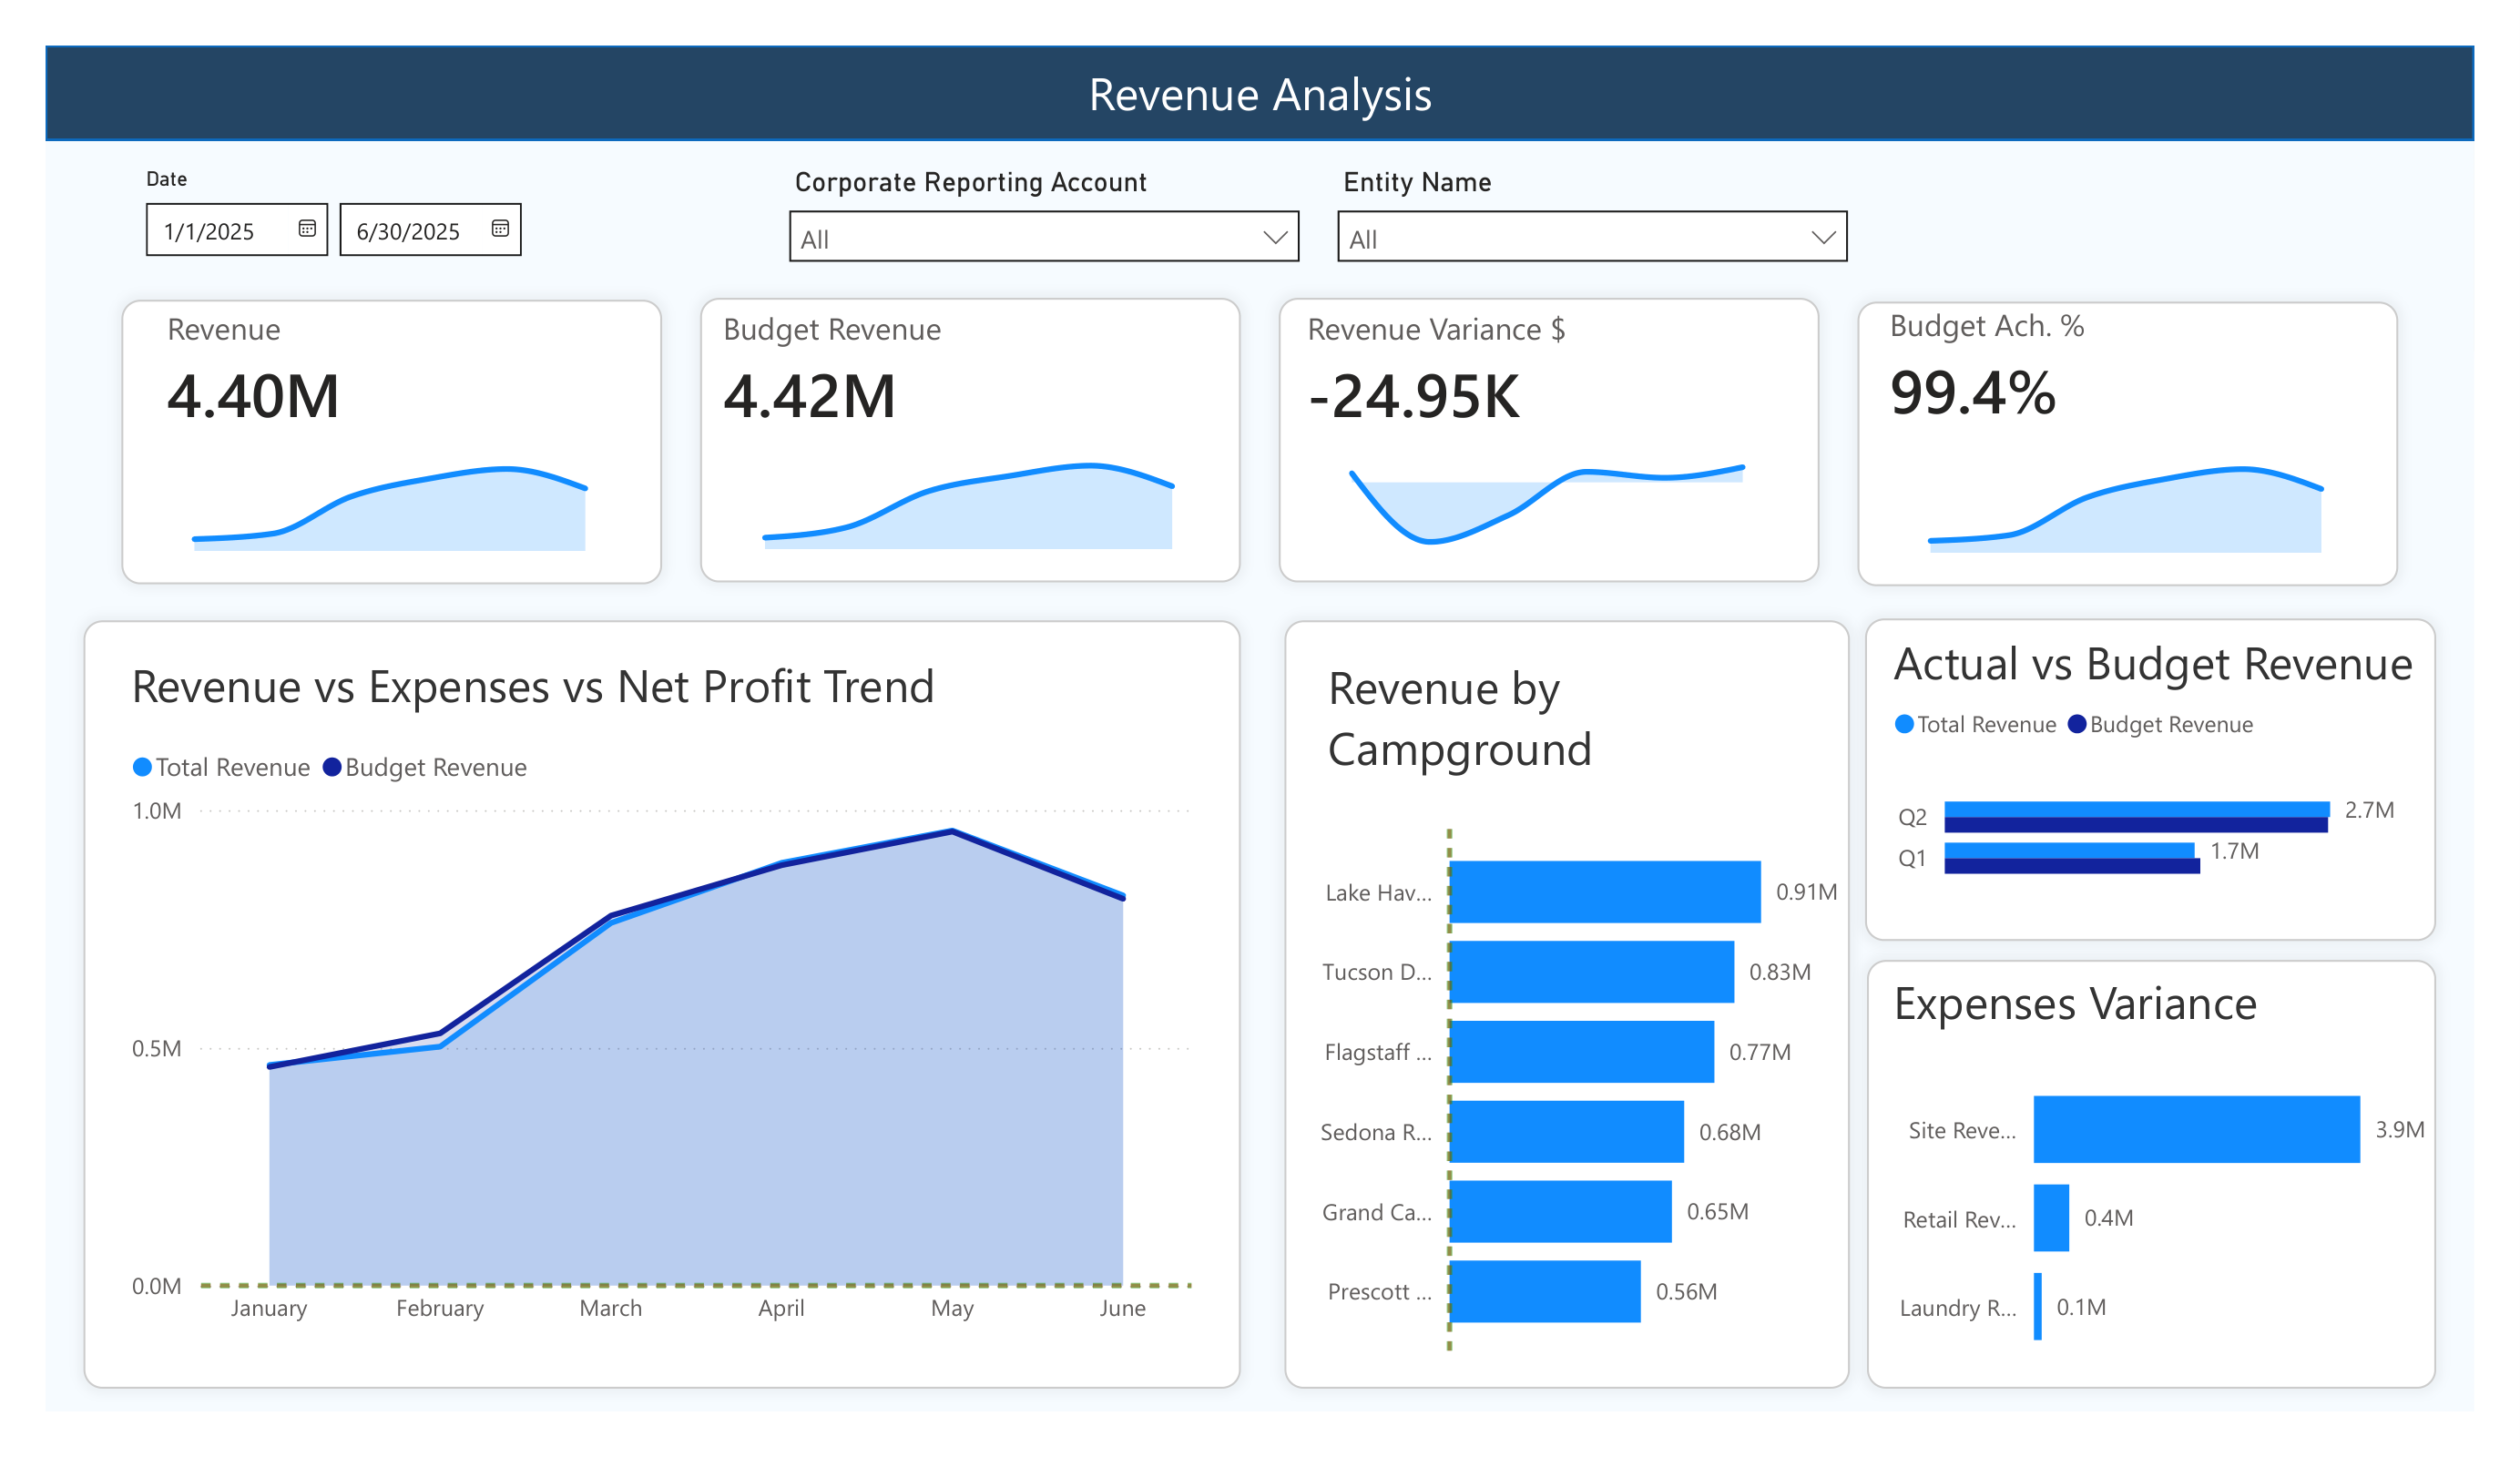
Total revenue for January 1, 2025 through June 30, 2025.
Net profit across the consolidated campground portfolio.
Portfolio-level profit margin for the reporting period.
Revenue achievement against plan, showing performance was nearly on target.
The analysis found that the campground portfolio was profitable, growing, and generally aligned with budget expectations. Revenue increased year-over-year, net profit improved, and profit margin remained strong.
The strongest management attention areas were not broad financial instability, but targeted issues: expense growth, location-level margin variation, site revenue underperformance, and specific budget gaps by campground.
The company was financially healthy overall. Management attention should focus on improving Site Revenue performance, reviewing Tucson margin pressure, and investigating Sedona's revenue shortfall against plan.
| Metric | Current Period | Prior Year | YoY Change |
|---|---|---|---|
| Revenue | $4.40M | $4.09M | +7.49% |
| Expenses | $2.29M | $2.14M | +7.11% |
| Net Profit | $2.11M | $1.95M | +7.91% |
| Profit Margin | 47.91% | 47.72% | +0.19 pts |
| Budget Revenue | $4.42M | — | — |
| Budget Achievement | 99.44% | — | — |
| Entity | Revenue | Net Profit | Margin | Budget Ach. |
|---|---|---|---|---|
| Lake Havasu RV Resort | $907,038 | $467,412 | 51.53% | 99.55% |
| Tucson Desert KOA | $829,530 | $377,354 | 45.49% | 99.38% |
| Flagstaff Mountain Campground | $771,267 | $361,267 | 46.84% | 99.40% |
| Sedona RV Resort | $683,233 | $322,685 | 47.23% | 98.50% |
| Grand Canyon Campground | $647,502 | $314,837 | 48.62% | 100.14% |
| Prescott KOA | $556,982 | $262,318 | 47.10% | 99.74% |
Built repeatable transformation logic for preparing transaction and budget data.
Mapped local entity accounts into a consistent corporate reporting structure.
Created fact and dimension tables for consolidated financial analysis.
Implemented relationships, calculations, and KPI logic inside Power BI.
Built leadership dashboard showing financial health and performance trends.
Created revenue monitoring by period, operating entity, and budget variance.