Data Preparation
Cleaned and standardized raw sample records, including timestamps, categorical fields, sample status, instrument assignment, and operational fields.
Power BI · SQL · Python · Operations Analytics
A business intelligence case study built around a synthetic production-support mining laboratory. The project converts raw sample-processing records into a structured analytical model and Power BI dashboard for tracking workload, turnaround time, SLA compliance, re-runs, pending samples, and operational bottlenecks.
The laboratory workflow included sample records with received timestamps, completed timestamps, sample types, departments, areas, technicians, instruments, priorities, statuses, and re-run indicators. Without a centralized reporting structure, managers would have limited visibility into whether turnaround time was improving or deteriorating, which workflows were missing SLA, and whether re-runs were creating hidden workload.
The central challenge was not simply creating visuals. The real objective was to create a reliable analytical model that could turn operational records into management-ready KPIs.
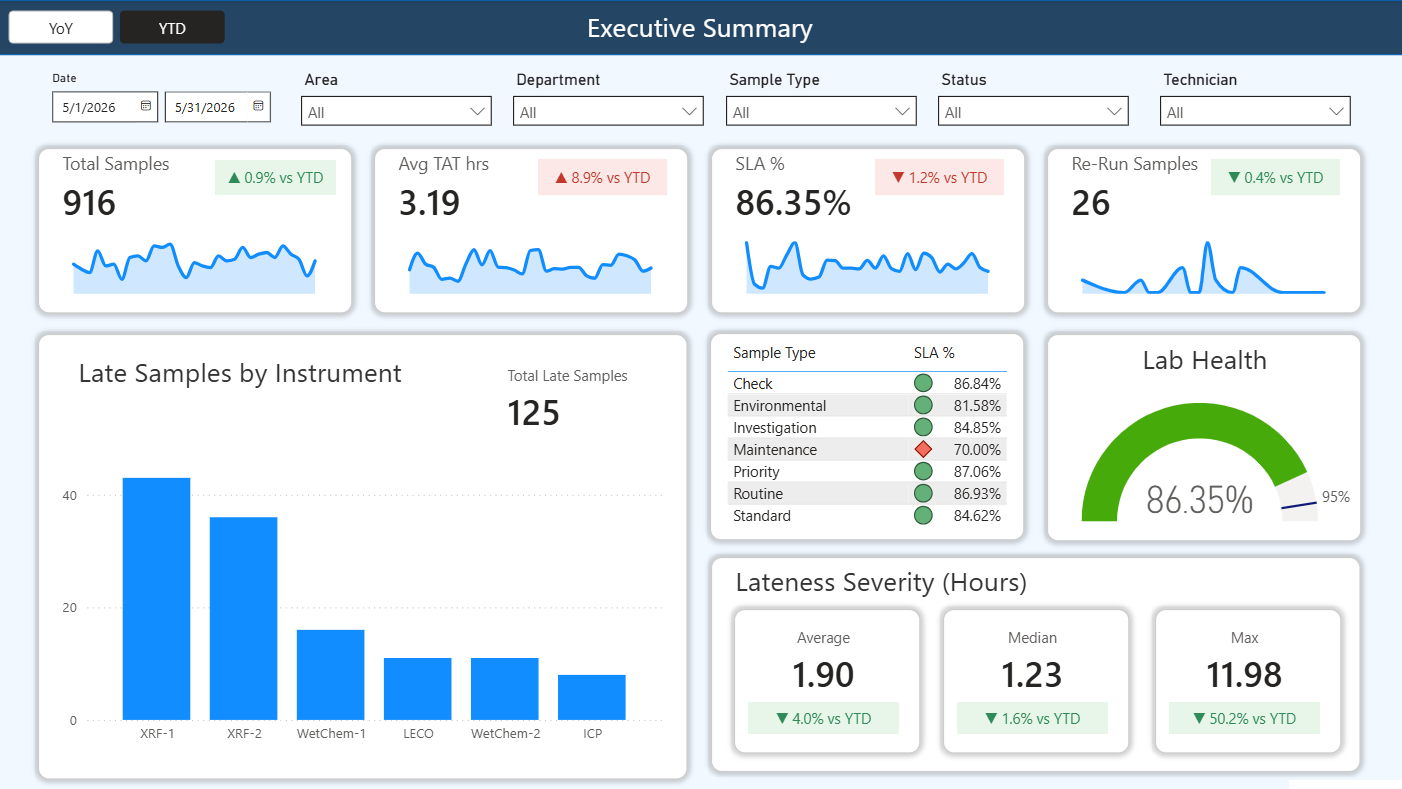
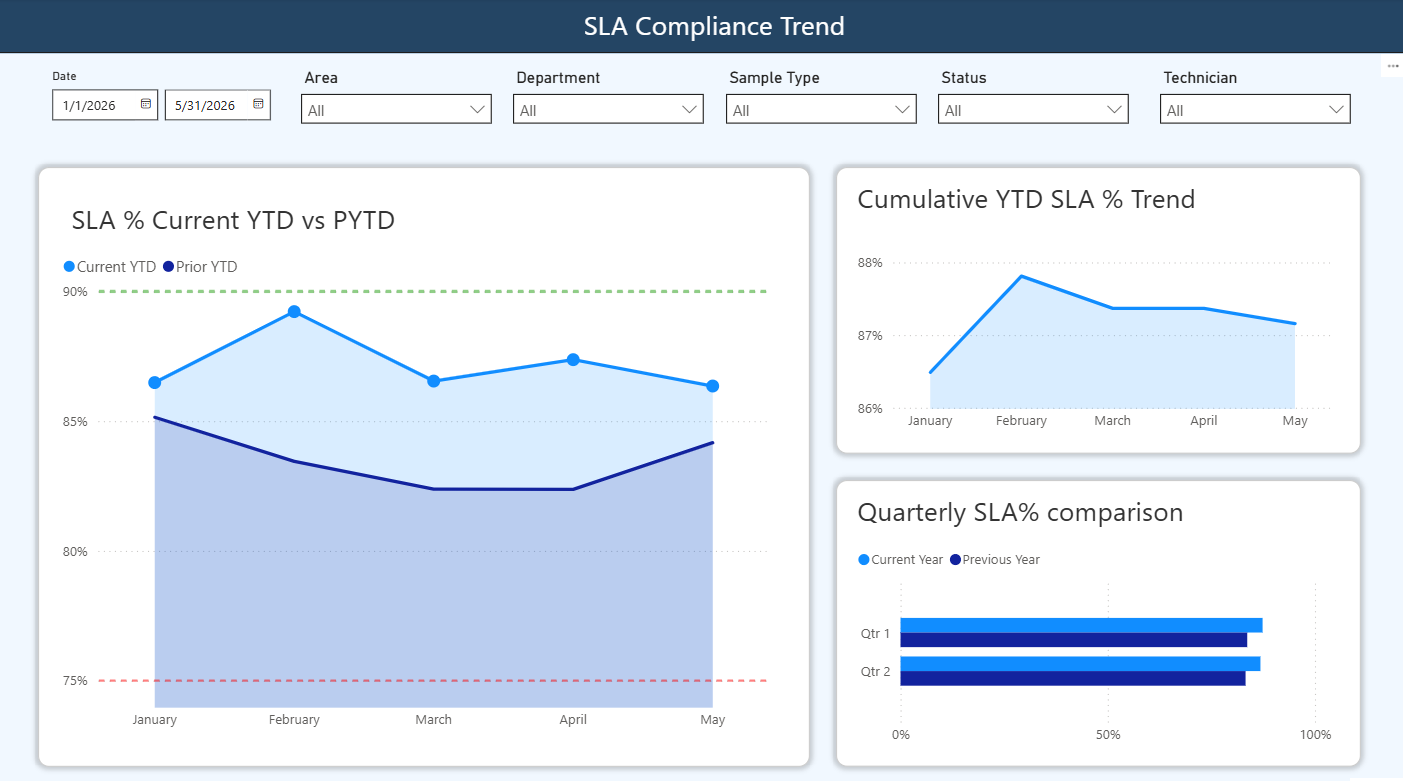
Cleaned and standardized raw sample records, including timestamps, categorical fields, sample status, instrument assignment, and operational fields.
Built a star-schema analytical model with a sample fact table and supporting dimensions for date, instrument, area, department, technician, and sample type rules.
Created measures for total samples, average turnaround time, SLA compliance, late samples, re-run rate, pending samples, and lateness severity.
Built executive and operational dashboard pages with KPI cards, slicers, trend visuals, comparison views, bottleneck indicators, and operational breakdowns.
Checked date coverage, orphan keys, null values, business rule consistency, and KPI calculation logic.
Interpreted the dashboard results into operational conclusions and management recommendations.
May workload was broadly consistent with the January-April normalized baseline.
Average turnaround increased from 2.93 hours to 3.19 hours.
SLA compliance declined from 87.37% to 86.35%.
Late samples increased against the normalized January-April baseline.
The analysis found that May workload was broadly stable, but operational performance weakened. Total sample volume was essentially flat, while average turnaround increased, SLA compliance declined, and late sample count increased.
The strongest evidence pointed to localized throughput pressure in XRF-supported workflows. XRF-1 and XRF-2 handled approximately 62% of May volume and both showed double-digit increases in average turnaround. The Smelter department also represented the largest share of volume, which amplified the impact of localized slowdown.
The performance decline was more consistent with localized throughput pressure than with a broad demand spike. Re-run volume and rush volume were effectively flat, making demand mix a less likely explanation.
| Finding | Signal | Interpretation |
|---|---|---|
| Stable workload | Total samples increased only slightly | Overall demand did not explain the performance decline. |
| Turnaround deterioration | Average turnaround increased | Processing slowed materially during the review period. |
| SLA decline | SLA compliance decreased | More samples missed expected service thresholds. |
| Flat re-run and rush volume | Re-runs and rush samples were stable | Demand mix and rework were less likely to be the primary cause. |
| XRF workflow pressure | XRF-1 and XRF-2 handled most volume and slowed significantly | Instrument-supported workflow congestion was the strongest bottleneck signal. |
| Smelter concentration | Smelter represented the largest share of volume | Department-level concentration amplified the impact of localized slowdown. |
Prepared raw operational data for dashboard reporting and KPI calculation.
Created fact and dimension tables suitable for Power BI analysis.
Built an executive Power BI dashboard for operational performance review.
Documented business logic for turnaround time, SLA compliance, re-runs, and pending samples.
Checked model integrity, calculation logic, date coverage, and business rule consistency.
Translated dashboard results into operational findings and management recommendations.